


- Posts: 5707
About PV, Wind and Batteries
- Paul Gilman
Less
More
14 Sep 2020 10:19 #8723
by Paul Gilman
Replied by Paul Gilman on topic About PV, Wind and Batteries
Hi Aldo,
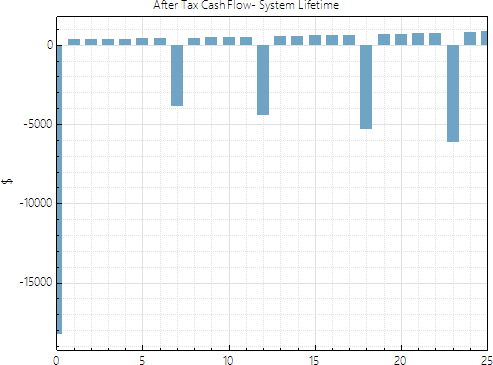
You can use the project after-tax cash flow to help identify ways to increase the net present value (NPV).
For example, in your "PV/Bat Condominio" case, the after-tax cash flow graph on the Summary page shows large expenses in Years 7, 12, etc. It also shows that the annual savings (positive) are very small compared to the Year 0 cost (negative), so even without those expenses, it is unlikely that this project will have a positive NPV.
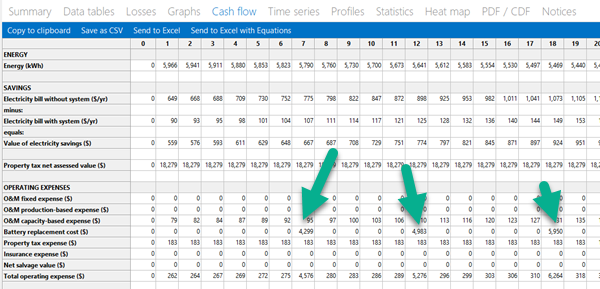
You can investigate further on the Cash Flow tab to see that those expenses are for battery replacements:
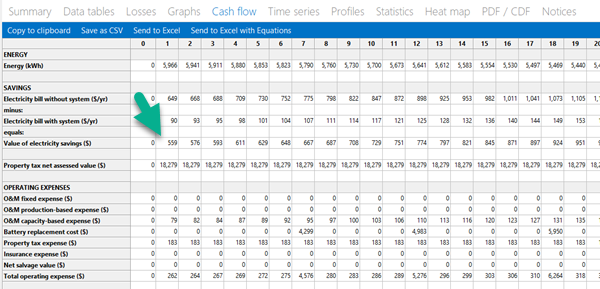
The cash flow also shows that the annual electricity bill savings are small compared to the costs:
To increase the NPV for that case, you could decrease the installation cost, adjust the battery dispatch to reduce the frequency of replacements, adjust the electricity rate, etc.
One observation is that the manual dispatch schedule on the Battery Storage page allows the battery to discharge between 10 am and 2 pm from November to April, and from 3 pm to 7 pm all year round. You might consider changing the dispatch schedule to better match the load profile so that the battery charges during the day when the sun is up and discharges at night when the load is high.
You can use similar techniques to investigate the cash flow of the other cases, and make adjustments to either decrease costs or increase the value of the system.
Best regards,
Paul.
You can use the project after-tax cash flow to help identify ways to increase the net present value (NPV).
For example, in your "PV/Bat Condominio" case, the after-tax cash flow graph on the Summary page shows large expenses in Years 7, 12, etc. It also shows that the annual savings (positive) are very small compared to the Year 0 cost (negative), so even without those expenses, it is unlikely that this project will have a positive NPV.
You can investigate further on the Cash Flow tab to see that those expenses are for battery replacements:
The cash flow also shows that the annual electricity bill savings are small compared to the costs:
To increase the NPV for that case, you could decrease the installation cost, adjust the battery dispatch to reduce the frequency of replacements, adjust the electricity rate, etc.
One observation is that the manual dispatch schedule on the Battery Storage page allows the battery to discharge between 10 am and 2 pm from November to April, and from 3 pm to 7 pm all year round. You might consider changing the dispatch schedule to better match the load profile so that the battery charges during the day when the sun is up and discharges at night when the load is high.
You can use similar techniques to investigate the cash flow of the other cases, and make adjustments to either decrease costs or increase the value of the system.
Best regards,
Paul.
Attachments:
Please Log in or Create an account to join the conversation.
- Aldo
- Topic Author
Less
More
- Posts: 19
21 Sep 2020 20:51 #8767
by Aldo
Replied by Aldo on topic About PV, Wind and Batteries
Hello Paul, I come with new questions.
It turns out that I need to know what the technical requirements are to simulate a housing complex, something like a condominium. So I did the corresponding simulations, multiplying by 20 the conditions that the simulation of a single house gave me. Apparently the wind and photovoltaic simulations worked for me but there is something strange with the solar thermal simulation, since changing the parameters does not increase the amount of energy necessary to cover the requirements of all the homes, the energy generated by the solar thermal system is a lot less than required.
How could I improve this situation? I think it has to do with the thermal capacity of the water or with the capacity of the system itself (pond, pipe, etc.), I tried to change some parameters but it did not work. The condo file is "Sistemas Condominio 2".
I also ask you please if you can check the parameters of the wind and photovoltaic systems in case I have any errors or something to improve.
Thank you very much for all the help you provide.
Best regards.
Attachments:
Please Log in or Create an account to join the conversation.
- Paul Gilman
Less
More
- Posts: 5707
22 Sep 2020 09:56 #8769
by Paul Gilman
Replied by Paul Gilman on topic About PV, Wind and Batteries
Hi Aldo,
For the solar water heating system, you may need to scale the hot water usage, number of collectors, and solar tank volume to represent multiple houses.
For the PV/Battery system, the inverter seems larger than it needs to be, but that should not affect your results unless you expect inverter power limiting or clipping to be a significant factor in your design.
Best regards,
Paul.
Please Log in or Create an account to join the conversation.
- Aldo
- Topic Author
Less
More
- Posts: 19
01 Oct 2020 17:48 #8804
by Aldo
Replied by Aldo on topic About PV, Wind and Batteries
Hi Paul, I have other queries about the summary and charts available to create.
What are the most important data to graph, or the best combination of data? from a mechanical-electrical(-economical) point of view.
I ask you this because the number of variables that SAM makes available is a lot, and I would not know how to correctly choose the combination of variables to make a graph that shows important data.
In the loss graph for the photovoltaic system, "DC module deviation from STC" appears, what does this refer to?
What is the importance of the "Monthly energy and load" graph?
To generate data on losses in SWH, is any additional information required for the selected equipment? There is an "Edit losses" option in System Availability, which I don't know how to use.
Best regards.
Please Log in or Create an account to join the conversation.
- Paul Gilman
Less
More
- Posts: 5707
05 Oct 2020 10:20 #8809
by Paul Gilman
Replied by Paul Gilman on topic About PV, Wind and Batteries
Hi Aldo,
I agree that SAM reports a lot of output variables. In general, high-level metrics like the net present value, annual energy, and capacity factor are useful quick indicators of potential problems, either with the assumptions, or with the design of the project. Otherwise, you can choose output variables that show aspects of your analysis that are important to you.
"DC module deviation from STC" in the loss diagram indicates how the module performs compared to its expected performance under standard test conditions (STC). It represents losses in the module's irradiance-to-electricity conversion process, accounting for temperature effects on module performance. For some locations that have a combination of high solar resource and low temperatures, the value can be negative.
The monthly energy and load graph on the Results page is useful for projects with net energy metering, where the electricity bill is calculated by comparing the total monthly generation with the total monthly load.
For all of SAM's performance models, the "System Availability Losses" are available to model factors that SAM does not consider. These may include system down time for maintenance or other situations that prevent the system from operating as designed.
Best regards,
Paul.
Please Log in or Create an account to join the conversation.
- Aldo
- Topic Author
Less
More
- Posts: 19
05 Oct 2020 21:42 #8814
by Aldo
Replied by Aldo on topic About PV, Wind and Batteries
Hi Paul.
On the monthly energy and load graph, there is a bar label that indicates the excess generation cumulative kWh credit earned, and that label appears in the photovoltaic system and in the wind system (in the attachment I have sent), but in the solar water heating system it does not appear. What does this parameter depend on so that it does not appear in the solar water heating system?
Another query, how can I export the information of electricity rates to excel?
Best regards.
Attachments:
Please Log in or Create an account to join the conversation.
Moderators: Paul Gilman