


- Posts: 8
Error in Macro: As Built-complete.sam using a PVsyst CSV file
- Emiliano Mejia
- Topic Author
Less
More
16 Aug 2023 20:24 #12427
by Emiliano Mejia
Replied by Emiliano Mejia on topic Error in Macro: As Built-complete.sam using a PVsyst CSV file
Thanks Paul, your file did work correctly but I still don't understand how did your file conversion work correctly and mine didn't? I followed your corrections (such as changing Wind for WindVel) yet the SAM CSV created is different. I also now tried to use the Macro with another file (attaching it) and while I was able to convert it correctly, I still got the message of it being out of limit with the irradiance values. Because of that I wasn't able to simulate a pv system as I got the next message: Simulation pvsamv1 failed :Out of range beam irradiance 3374.04 W/m2 at time [y:2022 m:1 d:1 h:16 minute:0], set to zero.
Comparing your recently attached CSV I see that the columns are out or order, does that have any significance or not really (considering it was automated by SAM)?
Best regards,
Emiliano
Comparing your recently attached CSV I see that the columns are out or order, does that have any significance or not really (considering it was automated by SAM)?
Best regards,
Emiliano
Attachments:
Please Log in or Create an account to join the conversation.
- Paul Gilman
Less
More
- Posts: 5707
17 Aug 2023 17:29 #12434
by Paul Gilman
Replied by Paul Gilman on topic Error in Macro: As Built-complete.sam using a PVsyst CSV file
Hi Emiliano,
You can click the View data button on the Location and Resource data to see graphs of the data in the file (after converting it to the SAM CSV format).
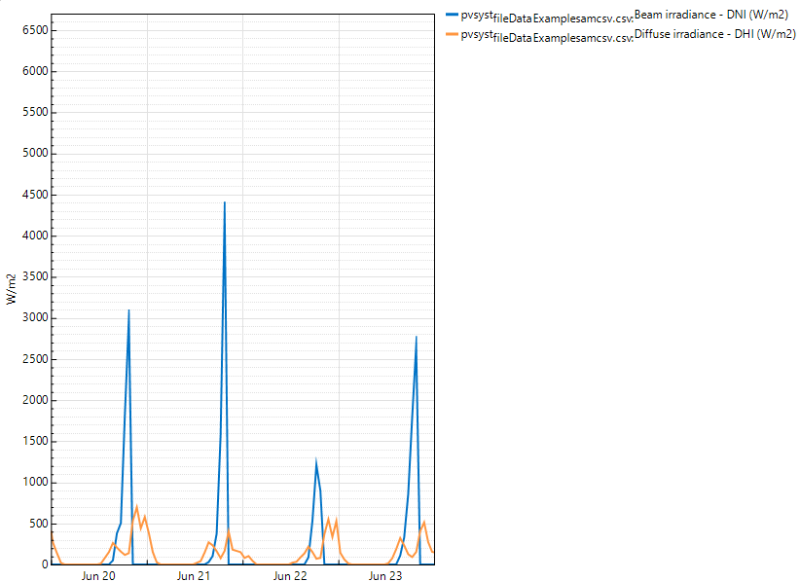
For a file I converted for the latest file you attached, the DNI and DHI does not look correct to me. For example around June 21 the DNI peaks at almost 4500 W/m2 and the DHI at around 450:
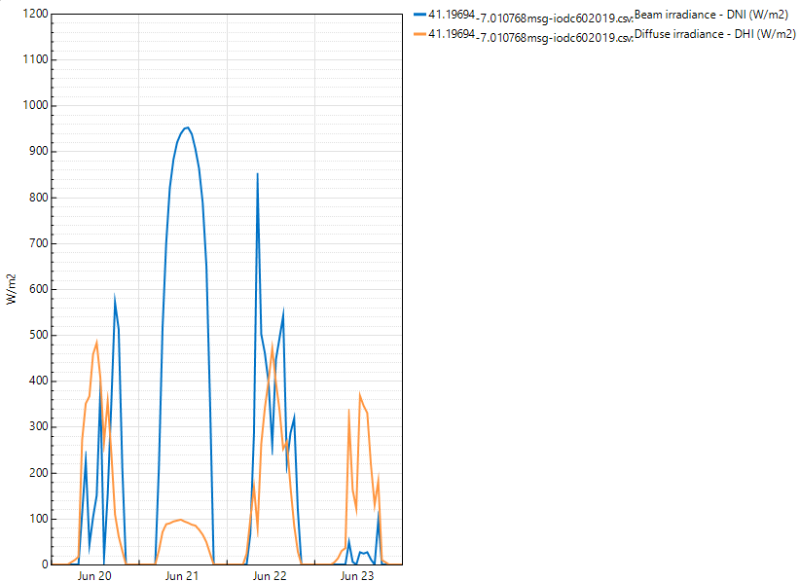
Here's what the data looks like for an NSRDB file I downloaded from SAM using the Advanced Download option. This is for the same latitude and longitude, but data for 2019:
Best regards,
Paul.
You can click the View data button on the Location and Resource data to see graphs of the data in the file (after converting it to the SAM CSV format).
For a file I converted for the latest file you attached, the DNI and DHI does not look correct to me. For example around June 21 the DNI peaks at almost 4500 W/m2 and the DHI at around 450:
Here's what the data looks like for an NSRDB file I downloaded from SAM using the Advanced Download option. This is for the same latitude and longitude, but data for 2019:
Best regards,
Paul.
Please Log in or Create an account to join the conversation.
- Emiliano Mejia
- Topic Author
Less
More
- Posts: 8
24 Aug 2023 09:43 #12455
by Emiliano Mejia
Replied by Emiliano Mejia on topic Error in Macro: As Built-complete.sam using a PVsyst CSV file
Thank you Paul for your answer and for adding the graphs to make it easier to notice the problems with the file attached. I managed to solve that part and I can now simulate in SAM a PV system with a PVsyst CSV. But now I have another question regarding the process of the macro in creating a SAM CSV file. In the case that I have data and a file without GHI but with POA (plain of array) data, is there a form I can directly use that string of data or is it always absolutely necessary for the file to have GHI in order for the macro to run correctly?
Thanks again for all the support and best regards,
Emiliano.
Thanks again for all the support and best regards,
Emiliano.
Please Log in or Create an account to join the conversation.
- Paul Gilman
Less
More
- Posts: 5707
25 Aug 2023 17:33 #12459
by Paul Gilman
Replied by Paul Gilman on topic Error in Macro: As Built-complete.sam using a PVsyst CSV file
Hi Emiliano,
I made some changes to the macro for the Fall 2023 release of SAM, including recognizing the PVsyst header "GPI" as POA data.
In the meantime, I think if you edit the PVsyst file to change "GPI" to "POA", the macro should include that column in the converted SAM CSV file. Or, if you run the macro without editing the PVsyst file first, I think the GPI column will be in the converted SAM CSV file, and you could edit it there.
Best regards,
Paul.
Please Log in or Create an account to join the conversation.
Moderators: Paul Gilman