


- Posts: 8
How is "battery number of cycles" computed?
- Nelson Koch
- Topic Author
Less
More
03 Feb 2020 03:09 #7927
by Nelson Koch
How is "battery number of cycles" computed? was created by Nelson Koch
Hi everyone,
I was wondering how is the "battery number of cycles" computed in practice?
According to the documentation, it is : "The running count of how many charge/discharge cycles have elapsed.", which seems relatively logical.
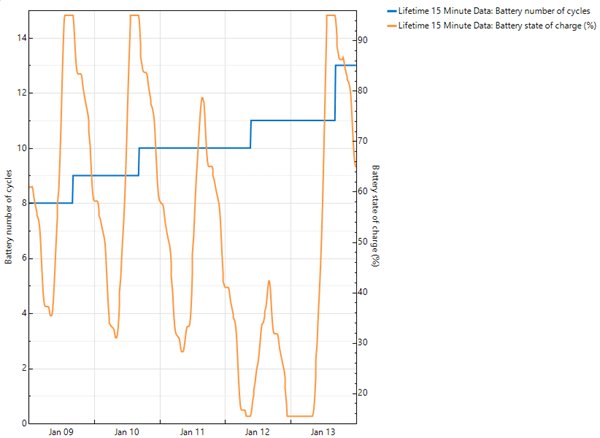
However, when looking at the time series, its seems that sometimes the cycle number is increase by steps of 3 (see figure attached) although only one charging/discharging cycle appears on the battery SoC. Note that I have 15-min resolution power profiles.
Did I miss something or is there an issue somewhere?
Thank you for your support!
Best,
Nelson
I was wondering how is the "battery number of cycles" computed in practice?
According to the documentation, it is : "The running count of how many charge/discharge cycles have elapsed.", which seems relatively logical.
However, when looking at the time series, its seems that sometimes the cycle number is increase by steps of 3 (see figure attached) although only one charging/discharging cycle appears on the battery SoC. Note that I have 15-min resolution power profiles.
Did I miss something or is there an issue somewhere?
Thank you for your support!
Best,
Nelson
Attachments:
Please Log in or Create an account to join the conversation.
- Paul Gilman
Less
More
- Posts: 5707
03 Feb 2020 10:51 - 03 Feb 2020 10:52 #7928
by Paul Gilman
Replied by Paul Gilman on topic How is "battery number of cycles" computed?
Hi Nelson,
As described in the introduction and Section 2.3 of DiOrio (2015) "Technoeconomic Modeling of Batttery Energy Storage in SAM," SAM's battery model uses a rainflow counting method to estimate the number of charge-discharge cycles. Such as method is necessary because the battery may not completely charge each time it is charged, or completely discharge each time it is discharged.
That publication and other battery-related ones are available here under "Battery Storage Publications:"
sam.nrel.gov/battery-storage.html
If you're interested, you can see the rainflow method in the C++ source code here (search for "rainflow"):
github.com/NREL/ssc/blob/develop/shared/lib_battery.cpp
In your graph, it looks like the cycle counting algorithm is being triggered by the small changes in state of charge, where the battery switches between charging and discharging for short periods. In my tests, I see results that make more intuitive sense:
Could you attach a copy of your .sam file orThis email address is being protected from spambots. You need JavaScript enabled to view it. so I can test it?
Best regards,
Paul.
As described in the introduction and Section 2.3 of DiOrio (2015) "Technoeconomic Modeling of Batttery Energy Storage in SAM," SAM's battery model uses a rainflow counting method to estimate the number of charge-discharge cycles. Such as method is necessary because the battery may not completely charge each time it is charged, or completely discharge each time it is discharged.
That publication and other battery-related ones are available here under "Battery Storage Publications:"
sam.nrel.gov/battery-storage.html
If you're interested, you can see the rainflow method in the C++ source code here (search for "rainflow"):
github.com/NREL/ssc/blob/develop/shared/lib_battery.cpp
In your graph, it looks like the cycle counting algorithm is being triggered by the small changes in state of charge, where the battery switches between charging and discharging for short periods. In my tests, I see results that make more intuitive sense:
Could you attach a copy of your .sam file or
Best regards,
Paul.
Attachments:
Last edit: 03 Feb 2020 10:52 by Paul Gilman.
Please Log in or Create an account to join the conversation.
- Nelson Koch
- Topic Author
Less
More
- Posts: 8
04 Feb 2020 06:03 #7933
by Nelson Koch
Replied by Nelson Koch on topic How is "battery number of cycles" computed? & issue with battery power profile?
Hi Paul,
Thank you for this detailed feedback.
I now realize that I didn't get the principle of rainflow counting quite well. After some more reading (such as that one ), things got much clearer.
However by looking more closely at this example, I've noticed a strange behavior of the battery power profile which seems to affect energy and efficiency data. Your feedback might be really helpful on this point as well.
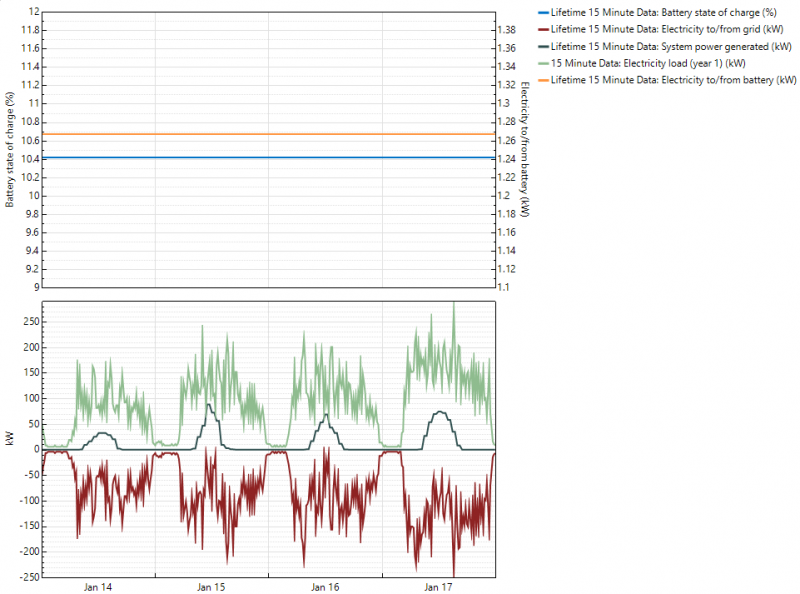
In this example, a system with a PV production (15-min), a load consumption (15-min) and a 100kWh battery is modeled. The dispatch controller of the battery is an "automated grid power target" fixed at 0kW (ie. the battery is used for self-consumption increase). The battery is allowed to charge from the PV only and no ancillary equipment losses were configured.
The figure below illustrates the different power flows (grid, battery, load and PV) as well as the battery state of charge. A zoom was made on a series of 4 consecutive days without PV overproduction. In can be observe here that the battery correctly stay discharge at its minimum allowed SoC (10%). However, the battery power (in orange) in non-null (~1.27kW).
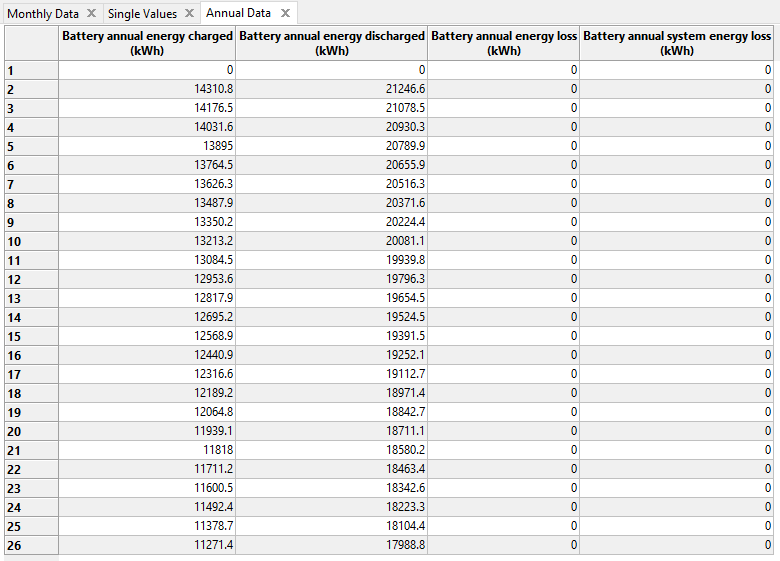
If we now look at the battery annual energy charged/discharged, we can observe a huge discrepancy between the charge and discharge energy (~7000kWh). This is certainly linked to the constant discharge power observed above.
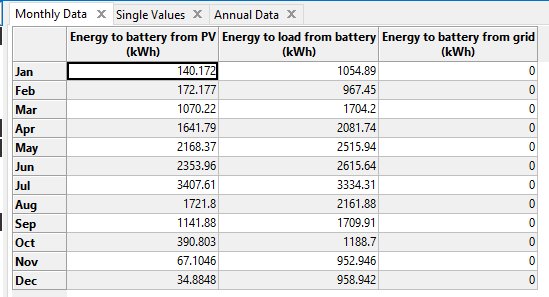
The same observation can be made on the monthly data, where the energy to load from battery is much higher than the one to battery from PV.
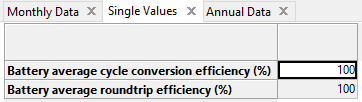
Finally, it seems to affect the conversion and roundtrip efficiency too. Indeed, they seem to saturate at 100% since the energy delivered by the battery is much higher than the supplied.
As asked, you I've attached the .sam file of the project. If you need any additional information, please let me know.
Thanks for the support.
Best,
Nelson
Thank you for this detailed feedback.
I now realize that I didn't get the principle of rainflow counting quite well. After some more reading (such as that one ), things got much clearer.
However by looking more closely at this example, I've noticed a strange behavior of the battery power profile which seems to affect energy and efficiency data. Your feedback might be really helpful on this point as well.
In this example, a system with a PV production (15-min), a load consumption (15-min) and a 100kWh battery is modeled. The dispatch controller of the battery is an "automated grid power target" fixed at 0kW (ie. the battery is used for self-consumption increase). The battery is allowed to charge from the PV only and no ancillary equipment losses were configured.
The figure below illustrates the different power flows (grid, battery, load and PV) as well as the battery state of charge. A zoom was made on a series of 4 consecutive days without PV overproduction. In can be observe here that the battery correctly stay discharge at its minimum allowed SoC (10%). However, the battery power (in orange) in non-null (~1.27kW).
If we now look at the battery annual energy charged/discharged, we can observe a huge discrepancy between the charge and discharge energy (~7000kWh). This is certainly linked to the constant discharge power observed above.
The same observation can be made on the monthly data, where the energy to load from battery is much higher than the one to battery from PV.
Finally, it seems to affect the conversion and roundtrip efficiency too. Indeed, they seem to saturate at 100% since the energy delivered by the battery is much higher than the supplied.
As asked, you I've attached the .sam file of the project. If you need any additional information, please let me know.
Thanks for the support.
Best,
Nelson
Please Log in or Create an account to join the conversation.
- Paul Gilman
Less
More
- Posts: 5707
04 Feb 2020 15:07 #7938
by Paul Gilman
Replied by Paul Gilman on topic How is "battery number of cycles" computed? & issue with battery power profile?
Hi Nelson,
Thank you for the detailed description and for attaching a .sam file. For reference, you are using the battery storage model for a Generic System / Residential configuration.
I think the issue you describe has been fixed in SAM Beta 2020.1.17. I opened your file in that version and ran a simulation, and found much more reasonable results. Would you mind trying that? You can download the Beta version from the Download page:
sam.nrel.gov/download/beta-version.html
Best regards,
Paul.
Please Log in or Create an account to join the conversation.
- Nelson Koch
- Topic Author
Less
More
- Posts: 8
05 Feb 2020 01:53 #7944
by Nelson Koch
Replied by Nelson Koch on topic How is "battery number of cycles" computed? & issue with battery power profile?
Hi Paul,
Once again, thank you for this great support.
Indeed, this issue seems to be fixed in in SAM Beta 2020.1.17. The data I get with this version are relevant.
Best,
Nelson
Once again, thank you for this great support.
Indeed, this issue seems to be fixed in in SAM Beta 2020.1.17. The data I get with this version are relevant.
Best,
Nelson
Please Log in or Create an account to join the conversation.
- Nelson Koch
- Topic Author
Less
More
- Posts: 8
06 Feb 2020 06:40 #7953
by Nelson Koch
Replied by Nelson Koch on topic How is "battery number of cycles" computed? & issue with battery power profile?
Hi Paul,
For the sake of completeness and to inform other user, it may be important to notice that this issue on SAM 2018.11.11 impacts the electricity bill and thus distorts the financial assessment of a system with a battery!
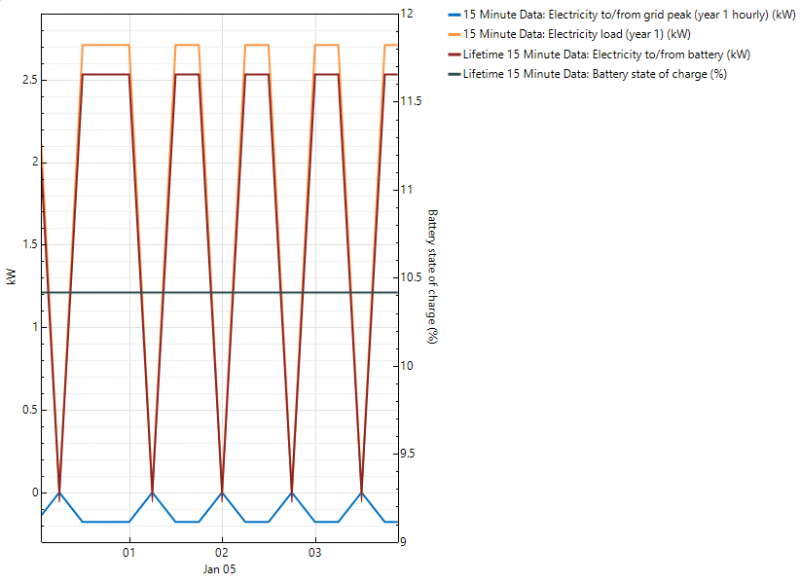
Indeed, this offset observed on the battery impact the time series "Electricity to/from grid peak (year 1 hourly)(kW)" which is used for the utility bill calculation. Hopefully, this issue is solved in the SAM Beta 2020.1.17.
To illustrate my point, here is just an illustration of SAM 2018.11.11, with an empty battery and square pattern load profile. It can be seen that the "power" falsely delivered by the battery reduces the grid power.
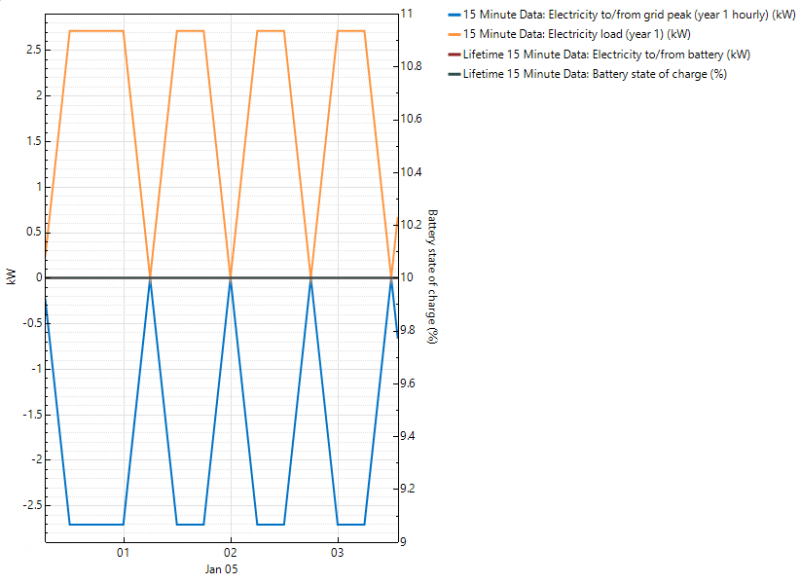
Same illustration but now with SAM Beta 2020.1.17, where the battery correctly delivers no power and the grid power equals the load power.
Best,
Nelson
For the sake of completeness and to inform other user, it may be important to notice that this issue on SAM 2018.11.11 impacts the electricity bill and thus distorts the financial assessment of a system with a battery!
Indeed, this offset observed on the battery impact the time series "Electricity to/from grid peak (year 1 hourly)(kW)" which is used for the utility bill calculation. Hopefully, this issue is solved in the SAM Beta 2020.1.17.
To illustrate my point, here is just an illustration of SAM 2018.11.11, with an empty battery and square pattern load profile. It can be seen that the "power" falsely delivered by the battery reduces the grid power.
Same illustration but now with SAM Beta 2020.1.17, where the battery correctly delivers no power and the grid power equals the load power.
Best,
Nelson
Attachments:
Please Log in or Create an account to join the conversation.
Moderators: Paul Gilman