


- Posts: 3
Add graph to Summary
- Mohammadreza Mohaddesnia
- Topic Author
Less
More
11 Dec 2025 05:19 #14409
by Mohammadreza Mohaddesnia
Add graph to Summary was created by Mohammadreza Mohaddesnia
In the photovoltaic section, after simulation, there are a series of charts in the summary. I want to add a very important chart (Energy losses) that was available in previous versions but is not there now. How can I do this?
I can create this chart in the "graph" tab, but every time I do this, it takes a lot of time. Can you help me figure out how to do this once so that the chart is always available in the Summary section? I would really appreciate your guidance.
I can create this chart in the "graph" tab, but every time I do this, it takes a lot of time. Can you help me figure out how to do this once so that the chart is always available in the Summary section? I would really appreciate your guidance.
Please Log in or Create an account to join the conversation.
- Paul Gilman
Less
More
- Posts: 5706
12 Dec 2025 16:42 #14414
by Paul Gilman
Replied by Paul Gilman on topic Add graph to Summary
Hi Mohamamd Reza,
Unfortunately, it is not possible to save the graph configuration on the Graphs tab of the Results page.
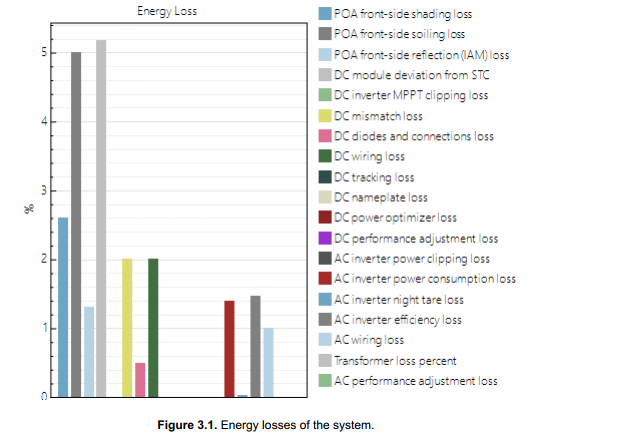
However, you can write an LK script to create a similar graph. For example, I used the attached plot-detailed-pv-losses.lk script to create the following plot:
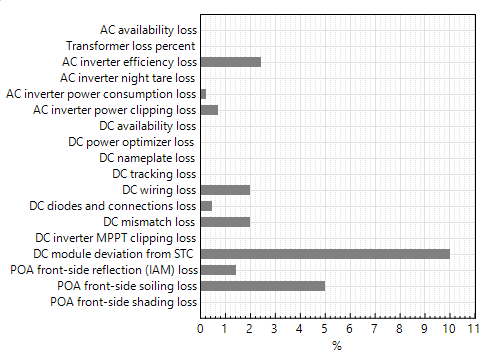
The script displays the plot in a window and then exports the plot as a .png image file.
To run the script:
1. Download and extract the attached plot-detailed-pv-losses.zip file.
2. Start SAM, and create or open a Detailed PV case.
3. Click Simulate to generate results.
4. On the File menu, click Open script and open the plot-detailed-pv-losses.lk file.
5. At the top of the script editor, click Run.
For more about LK script, see sam.nrel.gov/lk-script.html .
Best regards,
Paul.
Unfortunately, it is not possible to save the graph configuration on the Graphs tab of the Results page.
However, you can write an LK script to create a similar graph. For example, I used the attached plot-detailed-pv-losses.lk script to create the following plot:
The script displays the plot in a window and then exports the plot as a .png image file.
To run the script:
1. Download and extract the attached plot-detailed-pv-losses.zip file.
2. Start SAM, and create or open a Detailed PV case.
3. Click Simulate to generate results.
4. On the File menu, click Open script and open the plot-detailed-pv-losses.lk file.
5. At the top of the script editor, click Run.
For more about LK script, see sam.nrel.gov/lk-script.html .
Best regards,
Paul.
Attachments:
Please Log in or Create an account to join the conversation.
- Mohammadreza Mohaddesnia
- Topic Author
Less
More
- Posts: 3
12 Dec 2025 18:01 #14416
by Mohammadreza Mohaddesnia
Replied by Mohammadreza Mohaddesnia on topic Add graph to Summary
Dear Paul,
Thank you so much for your guidance. This solution was incredibly helpful and saved me a lot of time. I truly appreciate your assistance.
Best regards,
Mohammadreza.
Thank you so much for your guidance. This solution was incredibly helpful and saved me a lot of time. I truly appreciate your assistance.
Best regards,
Mohammadreza.
Please Log in or Create an account to join the conversation.
- Mohammadreza Mohaddesnia
- Topic Author
Less
More
- Posts: 3
20 Dec 2025 10:03 #14423
by Mohammadreza Mohaddesnia
Replied by Mohammadreza Mohaddesnia on topic Add graph to Summary
Dear Paul Gilman,
I hope you are doing well,
I am working on a university project where I need to design a complete photovoltaic system. I have a question. For selecting the optimal GCR for the system, I want to keep all parameters in SAM constant and only change the GCR, as well as the number of physical module rows for each GCR, to find out which configuration is the most optimal among the options I have. I think after simulating each of the GCRs, I should look for a parameter to compare the DC energy production of the modules, as I cannot compare AC energy because the type of inverters directly affects the AC energy. I want to know if I can use the DC capacity factor for this purpose, or should I use the DC power gross in the statistics tab? Also, is the approach I’m taking correct, or should I be looking at another parameter instead? I would really appreciate your guidance.
Best Regards,
Mohammadreza
Please Log in or Create an account to join the conversation.
- Paul Gilman
Less
More
- Posts: 5706
05 Jan 2026 10:40 #14438
by Paul Gilman
Replied by Paul Gilman on topic Add graph to Summary
Hi Mohammedreza,
I would use the following variables for your analysis:
Annual AC energy gross (kWh/yr)
Annual DC energy gross (kWh/yr)
Inverter clipping loss AC power limit (kWh/yr)
For the PV model, both versions of the capacity factor ("capacity factor based on total AC capacity" and "capacity factor based on nameplate DC capacity") are calculated from the net annual AC output of the system.
Here is a screenshot of results from parametric simulations on GCR:

Best regards,
Paul.
I would use the following variables for your analysis:
Annual AC energy gross (kWh/yr)
Annual DC energy gross (kWh/yr)
Inverter clipping loss AC power limit (kWh/yr)
For the PV model, both versions of the capacity factor ("capacity factor based on total AC capacity" and "capacity factor based on nameplate DC capacity") are calculated from the net annual AC output of the system.
Here is a screenshot of results from parametric simulations on GCR:
Best regards,
Paul.
Please Log in or Create an account to join the conversation.
Moderators: Paul Gilman