


- Posts: 10
Capacity Factor Difference between PVWatts-Battery and Detailed PV-Battery Model
- Ondrea
- Topic Author
Less
More
22 Apr 2024 09:11 - 22 Apr 2024 09:59 #13113
by Ondrea
Capacity Factor Difference between PVWatts-Battery and Detailed PV-Battery Model was created by Ondrea
Hello,
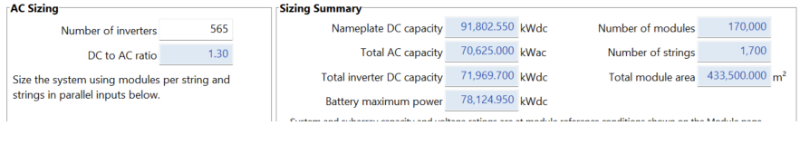
I am running SAM v. 2023.12.17 and when I model a detailed PV- Battery system, I get a very low Yr 1 DC capacity factor of 5.3% for a system in Virginia. I then duplicated the detailed PV - Battery model and changed the duplicate to a PV Watts - Battery model. The PV Watts - Battery model produces a more reasonable Yr 1 DC capacity factor of 15.6%. See screenshots below:
Detailed PV - Battery System Design and Summary
Attachments:
Last edit: 22 Apr 2024 09:59 by Paul Gilman. Reason: Please attach images as files and then insert them into your message
Please Log in or Create an account to join the conversation.
- Paul Gilman
Less
More
- Posts: 5698
22 Apr 2024 10:15 #13114
by Paul Gilman
Replied by Paul Gilman on topic Capacity Factor Difference between PVWatts-Battery and Detailed PV-Battery Model
Hi Ondrea,
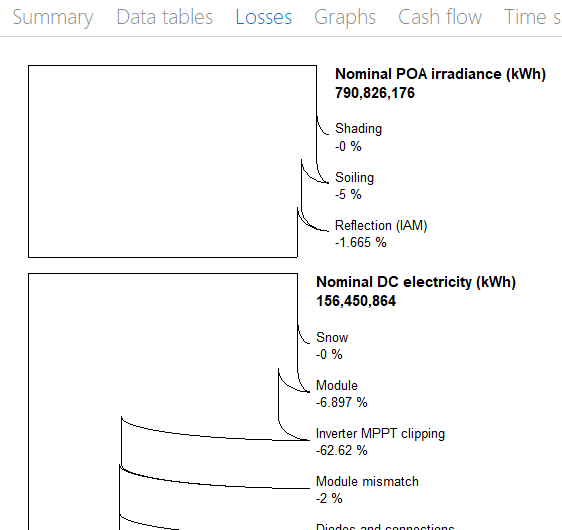
The low capacity factor for the Detailed PV case is caused by inverter clipping. You can see that on the Losses tab of the Results page:
Note the information on the System Design page indicating that the array's nominal maximum string voltage is higher than the inverter's maximum MPPT input voltage:
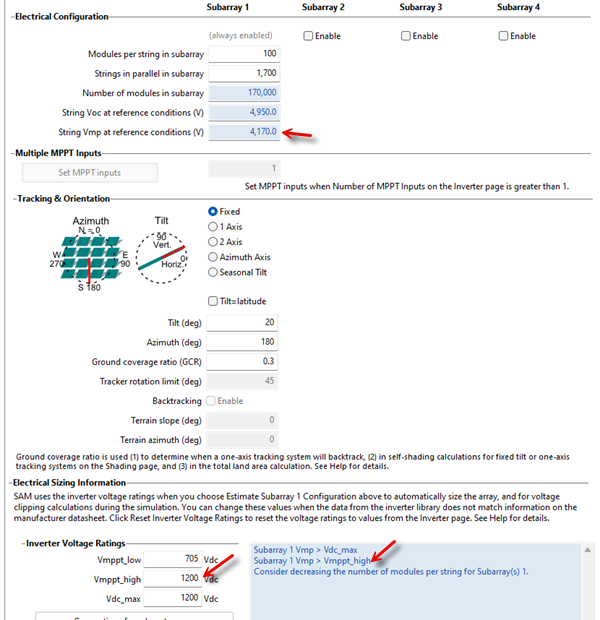
You can solve this problem by reducing the number of modules per string so that the string Voc at reference conditions is less than the inverter maximum MPPT voltage (Vmppt_high). If you want to maintain the same DC/AC ratio, you will also have to change the number of strings in parallel. For example, I changed modules per string to 24 and strings in parallel to 7100, which resulted in a DC capacity factor of 16.5%.
Best regards,
Paul.
The low capacity factor for the Detailed PV case is caused by inverter clipping. You can see that on the Losses tab of the Results page:
Note the information on the System Design page indicating that the array's nominal maximum string voltage is higher than the inverter's maximum MPPT input voltage:
You can solve this problem by reducing the number of modules per string so that the string Voc at reference conditions is less than the inverter maximum MPPT voltage (Vmppt_high). If you want to maintain the same DC/AC ratio, you will also have to change the number of strings in parallel. For example, I changed modules per string to 24 and strings in parallel to 7100, which resulted in a DC capacity factor of 16.5%.
Best regards,
Paul.
Please Log in or Create an account to join the conversation.
- Ondrea
- Topic Author
Less
More
- Posts: 10
22 Apr 2024 10:53 #13117
by Ondrea
Replied by Ondrea on topic Capacity Factor Difference between PVWatts-Battery and Detailed PV-Battery Model
Hi Paul,
Thanks so much for the quick and helpful response!
Kind regards,
Ondrea
Thanks so much for the quick and helpful response!
Kind regards,
Ondrea
Please Log in or Create an account to join the conversation.
Moderators: Paul Gilman