


- Posts: 1
Uncertainty Analysis
- Suphak
- Topic Author
Less
More
13 Nov 2023 22:56 #12648
by Suphak
Uncertainty Analysis was created by Suphak
Hello,
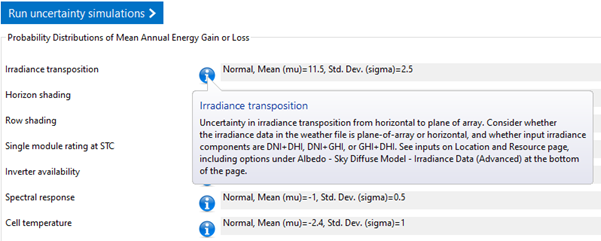
I have questions about the uncertainty analysis in the Detailed PV Model as follows (see screenshot below as a reference):
I have questions about the uncertainty analysis in the Detailed PV Model as follows (see screenshot below as a reference):
- What do these inputs mean?
According to the document ([url] www.nrel.gov/docs/fy23osti/84993.pdf [/url]), page 8, it says the values are presented as a percentage of the annual energy.
Does this mean that irradiance transposition for normal distribution will have:- The Mean (mu) value of 11.5% × 54,137.9 MWh/year = 6,225.859 MWh/year, and
- The standard deviation (sigma) would be 2.5% × 54,137.9 MWh/year = 1,353.448 MWh/year
- I think I have a misunderstanding here, could you please clarify so that I can fine tune these values properly?
- In case I get the P50 from the uncertainty analysis of 54,137.9 MWh/year, this value does not need to be the same value of a single year “TMY”, isn’t it?
because the uncertainty analysis will calculate based on multi-year inputs (in this case there are 23 years (1998-2020)), while TMY represents the typical year over these 23 years.
Do I understand correctly? - I noticed that it seems the “P50/P90 Simulations” has been replaced by the “Uncertainty” simulation?
Just curious if it would be possible to obtain a daily energy generation at each PXX from the “Uncertainty” analysis? - Would it be possible to run an uncertainty analysis on different values, besides annual energy generation?
- Would it be possible to export the values from the “uncertainty” results, for example from the graph?
- Would it be possible to know the value of the inter-annual variability (aleatory uncertainty) from the multi-year inputs?
Attachments:
Please Log in or Create an account to join the conversation.
- Paul Gilman
Less
More
- Posts: 5706
16 Nov 2023 17:41 #12656
by Paul Gilman
Replied by Paul Gilman on topic Uncertainty Analysis
Hi Suphak,
1. You can find a description of each input by clicking the "i" button next to the input's label:
2. Your interpretation of the values looks correct to me.
3. The P50 value is usually close to the TMY value. You are correct that they are different because they are based on different assumptions and calculations.
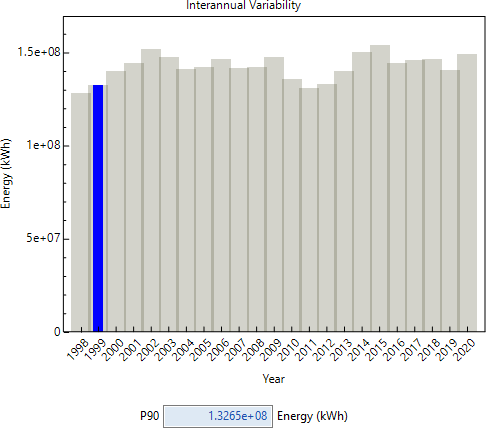
4. Yes, the new Uncertainty simulations replace the old P50/P90 ones for the Detailed PV and PVWatts models. The new feature shows you the year that represents the PXX value, so you can run a "regular" simulation by choosing the weather file for that year on the Location and Resource page and clicking Simulate. For example, this graph shows that the 1999 weather file generates the P90 annual energy value, so you could run a simulation with the 1999 weather file to see the daily profiles and other results.
5. No. The uncertainty analysis is based on annual energy.
6. Yes. You can right-click graphs to export either an image of the graph or the data it displays.
7. The graphs show the interannual variability of annual energy caused by variability in the solar resource data. You would have to analyze the data in the weather files themselves to determine other values of variability.
Best regards,
Paul.
1. You can find a description of each input by clicking the "i" button next to the input's label:
2. Your interpretation of the values looks correct to me.
3. The P50 value is usually close to the TMY value. You are correct that they are different because they are based on different assumptions and calculations.
4. Yes, the new Uncertainty simulations replace the old P50/P90 ones for the Detailed PV and PVWatts models. The new feature shows you the year that represents the PXX value, so you can run a "regular" simulation by choosing the weather file for that year on the Location and Resource page and clicking Simulate. For example, this graph shows that the 1999 weather file generates the P90 annual energy value, so you could run a simulation with the 1999 weather file to see the daily profiles and other results.
5. No. The uncertainty analysis is based on annual energy.
6. Yes. You can right-click graphs to export either an image of the graph or the data it displays.
7. The graphs show the interannual variability of annual energy caused by variability in the solar resource data. You would have to analyze the data in the weather files themselves to determine other values of variability.
Best regards,
Paul.
Please Log in or Create an account to join the conversation.
- Adam Gallaher
Less
More
- Posts: 19
23 Oct 2024 11:10 #13545
by Adam Gallaher
Replied by Adam Gallaher on topic Uncertainty Analysis
Hello,
I have a follow up question for calculating uncertainty. It seems that the uncertainty analysis is done for a single location (e.g., lat/long or address). What if one wanted to calculate the uncertainty for multiple location. Is there a programmatic approach to achieve that, or is it just not possible?
Thank you,
Adam
Please Log in or Create an account to join the conversation.
- Paul Gilman
Less
More
- Posts: 5706
24 Oct 2024 12:09 #13550
by Paul Gilman
Replied by Paul Gilman on topic Uncertainty Analysis
Hi Adam,
The PV uncertainty feature in SAM is designed to explore the effect of uncertainty caused by interannual variability in the solar resource and the assumptions for a few key parameters for a single location. You can run uncertainty simulations for different locations by choosing weather files for different locations, but you have to do that manually by choosing a different weather file folder on the Uncertainty page and clicking the Run uncertainty simulations button for each location.
Best regards,
Paul.
Please Log in or Create an account to join the conversation.
- Adam Gallaher
Less
More
- Posts: 19
25 Oct 2024 06:30 #13555
by Adam Gallaher
Replied by Adam Gallaher on topic Uncertainty Analysis
Hello Paul, Thank you for the feedback, I greatly appreciate it.
Adam
Adam
Please Log in or Create an account to join the conversation.
- Paul Gilman
Less
More
- Posts: 5706
25 Oct 2024 17:03 #13556
by Paul Gilman
Replied by Paul Gilman on topic Uncertainty Analysis
Hi Adam,
I'll add that we are considering creating a PySAM helper function to make it possible to automate PV uncertainty analysis in Python using the NREL PySAM package -- we'll have to get that work funded and into our workplan, but it shouldn't be a huge effort.
Best regards,
Paul.
I'll add that we are considering creating a PySAM helper function to make it possible to automate PV uncertainty analysis in Python using the NREL PySAM package -- we'll have to get that work funded and into our workplan, but it shouldn't be a huge effort.
Best regards,
Paul.
Please Log in or Create an account to join the conversation.
Moderators: Paul Gilman