


- Posts: 14
Autonomy outage probability output metrics
- hhundt
- Topic Author
Less
More
06 Jun 2022 11:56 #11080
by hhundt
Autonomy outage probability output metrics was created by hhundt
HI--
Wondering if there is any SAM literature explaining the output metrics "Hours of autonomy during grid outage probabilities." What is included in the SAM help doc is somewhat limited.
Thanks,
Henry
Wondering if there is any SAM literature explaining the output metrics "Hours of autonomy during grid outage probabilities." What is included in the SAM help doc is somewhat limited.
Thanks,
Henry
Please Log in or Create an account to join the conversation.
- Paul Gilman
Less
More
- Posts: 5707
07 Jun 2022 12:10 - 19 Feb 2025 17:05 #11084
by Paul Gilman
Replied by Paul Gilman on topic Autonomy outage probability output metrics
Hi Henry,
SAM's grid outage feature is available for systems with battery storage. It based on REopt's "Resilience" feature described in Section 18.5 i]Section 8 "Resilience Analysis" -- Edit 2/19/2025[/i of the REopt User Manual: reopt.nrel.gov/tool/reopt-user-manual.pdf .
There are two options for grid outages:
For Meet critical load during outage time steps, you specify a critical load and the times when outages occur. SAM runs the simulation over the analysis period. During periods with no grid outage, it dispatches the battery based on the parameters you specify on the Battery Dispatch page. When it encounters a grid outage, it temporarily dispatches the battery to meet the outage, and then returns to the original battery dispatch strategy.
For this option, the relevant outputs (in addition to the usual battery state of charge, electricity to load from battery, electricity to load from system, etc.) are:
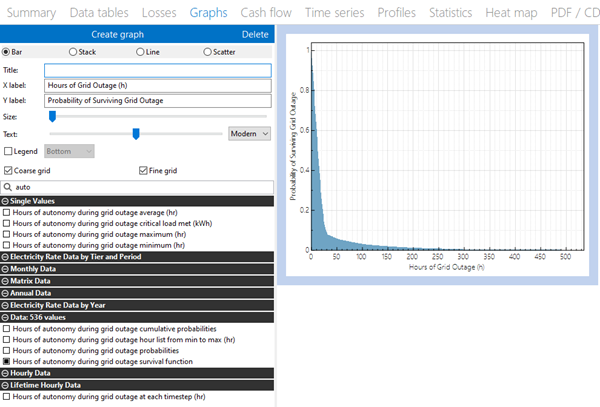
For Calculate hours of autonomy for a hypothetical outage, SAM calculates the number of hours your system design would meet the load without any power from the grid. To do this, SAM runs the normal simulation plus a series of simulations starting at each time step of the year to see how many time steps the system can meet the load with no grid power. It then reports "hours of autonomy" metrics to indicate the minimum, maximum, and average length of power outage that the system can meet the load. Depending on your system design, this calculation takes longer than a normal simulation because it requires starting a new simulation for each time step.
The outputs for this option the outputs include "Hours of autonomy" in the label:Single value
Best regards,
Paul.
SAM's grid outage feature is available for systems with battery storage. It based on REopt's "Resilience" feature described in Section 18.5 i]Section 8 "Resilience Analysis" -- Edit 2/19/2025[/i of the REopt User Manual: reopt.nrel.gov/tool/reopt-user-manual.pdf .
There are two options for grid outages:
For Meet critical load during outage time steps, you specify a critical load and the times when outages occur. SAM runs the simulation over the analysis period. During periods with no grid outage, it dispatches the battery based on the parameters you specify on the Battery Dispatch page. When it encounters a grid outage, it temporarily dispatches the battery to meet the outage, and then returns to the original battery dispatch strategy.
For this option, the relevant outputs (in addition to the usual battery state of charge, electricity to load from battery, electricity to load from system, etc.) are:
- Grid outage in this timestep
- Critical load in this timestep
- Critical load unmet in this timestep
- Critical load energy (Year 1 and monthly)
- Critical load energy unmet (Year 1 and monthly)
- Critical load unmet percentage (Year 1 and monthly)
For Calculate hours of autonomy for a hypothetical outage, SAM calculates the number of hours your system design would meet the load without any power from the grid. To do this, SAM runs the normal simulation plus a series of simulations starting at each time step of the year to see how many time steps the system can meet the load with no grid power. It then reports "hours of autonomy" metrics to indicate the minimum, maximum, and average length of power outage that the system can meet the load. Depending on your system design, this calculation takes longer than a normal simulation because it requires starting a new simulation for each time step.
The outputs for this option the outputs include "Hours of autonomy" in the label:Single value
- Hours of autonomy during grid outage (min, avg, max): A count of the number of hours the system was able to meet the load without the grid.
- Hours of autonomy during grid outage critical load met (kWh): The total load met by the battery and system over the hours of grid outage.
- Cumulative probabilities
- Hour list from min to max
- Probabilities
- Survival function
Best regards,
Paul.
Last edit: 19 Feb 2025 17:05 by Paul Gilman.
Please Log in or Create an account to join the conversation.
- hhundt
- Topic Author
Less
More
- Posts: 14
07 Jun 2022 12:34 #11086
by hhundt
Replied by hhundt on topic Autonomy outage probability output metrics
Thank you, Paul. Definitely interested in a possible webinar on this subject!
Please Log in or Create an account to join the conversation.
Moderators: Paul Gilman