


- Posts: 23
Graph plotted for LCOE vs SM for a location with high solar irradiation
- Weng Pin Wong
- Topic Author
Less
More
08 Aug 2021 00:06 - 16 Aug 2021 15:39 #9916
by Weng Pin Wong
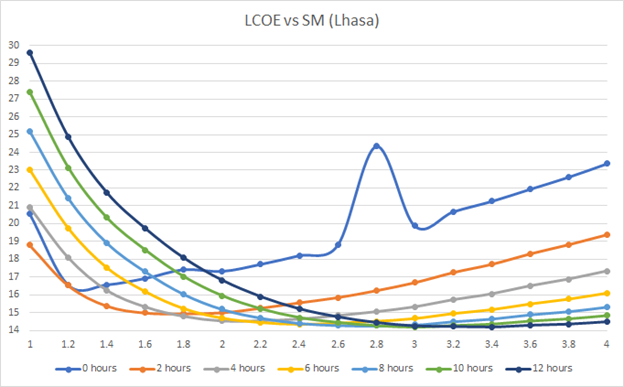
Graph plotted for LCOE vs SM for a location with high solar irradiation was created by Weng Pin Wong
Dear Paul,
The picture below is a graph plotted based on the simulation of CSP-PTC plant in a location with high solar irradiation (Lhasa). I found that the graph plotted when the TES hours is 0, the trend of the curve is quite different from other cases with TES. Although I found some similar trend from some studies but this graph seems deviates a lot around the SM value of 8, may I know is this trend normal or do I make some mistakes during the simulation?
Hope to hear from you soon!
Best Regards,
Weng Pin.
Attachments:
Last edit: 16 Aug 2021 15:39 by Paul Gilman.
Please Log in or Create an account to join the conversation.
- Paul Gilman
Less
More
- Posts: 5707
16 Aug 2021 15:44 #9949
by Paul Gilman
Replied by Paul Gilman on topic Graph plotted for LCOE vs SM for a location with high solar irradiation
Hi Weng Pin,
I'm not sure what is causing that anomaly in your results.
Best regards,
Paul.
I'm not sure what is causing that anomaly in your results.
Best regards,
Paul.
Please Log in or Create an account to join the conversation.
Moderators: Paul Gilman