


- Posts: 5706
Battery Degradation and SOC
- Paul Gilman
- Topic Author
Less
More
27 May 2020 16:37 #8241
by Paul Gilman
Battery Degradation and SOC was created by Paul Gilman
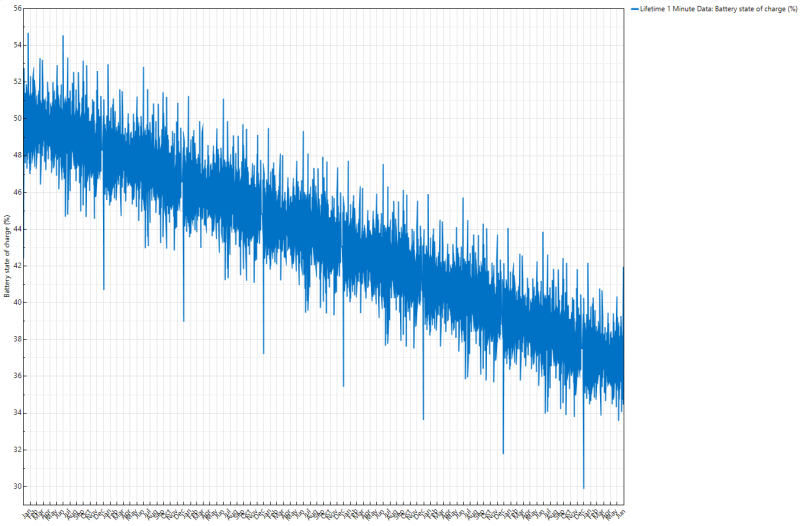
After disabling battery degradation, the battery state of charge (SOC) appears to decrease over time. What other factors affect the battery's SOC?
Attachments:
Please Log in or Create an account to join the conversation.
- Paul Gilman
- Topic Author
Less
More
- Posts: 5706
27 May 2020 16:59 - 14 Mar 2022 06:01 #8242
by Paul Gilman
Replied by Paul Gilman on topic Battery Degradation and SOC
The graph above shows a decrease in SOC over time. A plot of battery capacity should show that the capacity is constant over time because the degradation model is disabled.
SAM models are two loss effects for Li-ion batteries that cause this decrease in SOC over time
First, internal resistance contributes to loss of charge over time.
Second, there are losses associated with voltage hysteresis resulting from the charge voltage being slightly higher than the discharge voltage: Given the same amount of power for charging and discharging, the charge current is lower than the discharge current, which causes the coulombs (energy) in the battery to decline over time due to heat losses and mechanical strain on the battery cells. This effect is modeled using the approach described in Tremblay, O.; Dessaint, L. (2009) Experimental Validation of a Battery Dynamic Model for EV Applications , World Electric Vehicle Journal Vol 3 No 2 289-298, and explained in this University of Colorado - Colorado Springs course .
To force the SOC to be more constant over time in SAM, you can set the cells internal resistance to zero. You could also try using the voltage table model instead of the Li-ion voltage model.
Best regards,
Paul.
Last edit: 14 Mar 2022 06:01 by Paul Gilman.
Please Log in or Create an account to join the conversation.
- soni123
Less
More
- Posts: 1
13 Mar 2022 23:12 #10669
by soni123
Replied by soni123 on topic Battery Degradation and SOC
The losses caused by voltage hysteresis (where the charge voltage is slightly higher than the discharge voltage) are as follows: The charge current is smaller than the discharge current when the power for charging and discharging is equal, causing the coulombs (energy) in the battery to decrease over time owing to heat losses and mechanical strain on the battery cells.
Please Log in or Create an account to join the conversation.
- Bobby
Less
More
- Posts: 1
04 Mar 2024 11:55 - 06 Mar 2024 17:30 #12957
by Bobby
Replied by Bobby on topic Battery Degradation and SOC
Hello Paul,
I'm just trying to further understand the way SOC is calculated and the way degradation is modelled. I'm running a PV-Battery, Residential model and I was trying to recreate the Battery State of Charge column (lifetime hourly data) using the initial charge (80%) and the following columns: Electricity to/from Battery AC, Battery loss from power electronics. I divided both columns by my bank capacity and added them to the initial charge. My SOC column starts out close to the model's SOC but eventually surpasses it and goes over 100%.
This leads me to my questions:
1) There's a battery maximum charge with degradation column (Ah). I tried using this value (converted to kwh), which is higher than my bank capacity, to calculate percent added to SOC. Are either of these values correct to use?
2) Is the difference between the two columns due to hysteresis modeling? is that degradation modelled at the hourly level? Or is there some kind of smoothing in the model to make sure that the battery doesn't go above or below thresholds?
Thank you!
Last edit: 06 Mar 2024 17:30 by Paul Gilman. Reason: Please attach images as files and then insert them into your message
Please Log in or Create an account to join the conversation.
- Paul Gilman
- Topic Author
Less
More
- Posts: 5706
06 Mar 2024 17:40 #12960
by Paul Gilman
Replied by Paul Gilman on topic Battery Degradation and SOC
Hi Bobby,
For best results, to include an image in your message, attach it as a file (png, bmp, jpg) and then insert it into your message.
The differences between the some of the values is small, and may be rounding differences between your calculations and SAM's internal calculations.
In some cases, the difference may be between AC and DC values. Depending on whether the battery is AC- or DC-connected you may need to apply the DC/AC or AC/DC conversion factor based on the inputs under "Power Converters" section of the Battery Cell and System page.
Best regards,
Paul.
Please Log in or Create an account to join the conversation.
Moderators: Paul Gilman