


- Posts: 4
TMY (PVGIS data) vs. actual year discrepancy (merra-2 data)
- Stefan_E
- Topic Author
Less
More
21 Oct 2019 14:49 #7748
by Stefan_E
TMY (PVGIS data) vs. actual year discrepancy (merra-2 data) was created by Stefan_E
Hi all,
new to SAM (amazing tool!) I'm trying to simulate a photo-voltaic setup. As I'm located in Europe, weather files are a bit of an issue.
Never mind - and thanks to the great help on SAMs web page , I found a typical meteorological year TMY through PGVIS . This creates in my setup an annual energy output of 7850kWh.
Next, I downloaded annual weather files with getmerra2 / makeweatherfiles (see Siren Toolkit) for years 2001 - 2019 and run against the exact same setup. Now my annual energy output is between 10787kWh and 12099kWh,
I compared an arbitrary year: GHI correlates with R2 = 0.68 between TMY and a year 2001 on an hourly basis. However, total over year is 824kW/m^2 (TMY) vs. 1238kW/m^2 (arbitrary year), which more or less explains the additional output of my setup.
However - what's going on underneath? Where do I start searching?
Thanks for any help!
Stefan
Please Log in or Create an account to join the conversation.
- Paul Gilman
Less
More
- Posts: 5707
22 Oct 2019 10:30 #7749
by Paul Gilman
Replied by Paul Gilman on topic TMY (PVGIS data) vs. actual year discrepancy (merra-2 data)
Hi Stefan,
This page on the PVGIS website provides information about their data:
re.jrc.ec.europa.eu/pvg_static/methods.html
Here is a link to the MERRA website and documentation:
gmao.gsfc.nasa.gov/reanalysis/MERRA/
And, as you know the SIREN toolkit website has documentation as well:
sourceforge.net/projects/sensiren/
And, this NREL publication is a little out of date now, but still has a lot of useful information:
Sengupta, M.; Habte, A.; Kurtz, S.; Dobos, A.; Wilbert, S.; Lorenz, E.; Stoffel, T.; Renne, D.; Myers, D.; Wilcox, S.; Blanc, P.; Perez, R. (2015). "Best Practices Handbook for the Collection and Use of Solar Resource Data for Solar Energy Applications." NREL Report No. TP-5D00-63112. ( PDF 8.9 MB )
Good luck with your search, and let us know what you find!
Best regards,
Paul.
Please Log in or Create an account to join the conversation.
- Stefan_E
- Topic Author
Less
More
- Posts: 4
27 Oct 2019 14:28 #7760
by Stefan_E
Replied by Stefan_E on topic TMY (PVGIS data) vs. actual year discrepancy (merra-2 data)
Hi Paul,
thanks for your help. Especially the handbook link proved helpful to get some better understanding.
But upfront an apology: the quoted very low system performance of 7850kWh/a was not based on TMY from PVGIS, but from EnergyPlus (too many files on my disk right now). The TMY from PVGIS (in it's 2007 - 2016 incarnation) results in a system output of 9849kWh. This narrows the gap to merra, but it's still ~16%; the PVGIS output sounds more reasonable, talking to local providers of PV systems here.
So, let's dig a level deeper. First, the handbook (p. 33, chapter 2.4.3) educated me on the fundamental equation (... now you know from which level of understanding I'm coming from ):
):
GHI = DNI*cos(SZA) + DHI
For merra, Siren's makeweatherfiles help file states: DNI is computed using formulae derived from the NREL Centre for Renewable Energy Resources DISC DNI Model. The handbook gives some background on p.33ff. with the caveat 'The model is not a rigorous physical algorithm, because the coefficients for computing clear-sky transmittance values were derived from empirical regression analyses of measured DNI and GHI data from Atlanta, Georgia'
The handbook also explains in 5.4.15 for PVGIS (albeit for an old version and not the current v5.0) that 'Monthly averages of daily sums of global and diffuse irradiation measured or calculated for 566 ground meteorological stations distributed over the region.'
Based on this, I investigated GHI - DHI = Direct_Irradiation, which is then the direct contribution to the radiation. Plotting Direct_Irradiation for SARAH vs. Merra (with hourly data), it becomes obvious that in many instances where SARAH has zero or very small values, Merra has substantial contributions (up to 600 W/m2) of direct radiation. To quantify this, let's bucket Direct_Irradiation(SARAH) into buckets of 10 W/m2 and then for each bucket calculate
Gs = sum(GHI(SARAH))
Gm = sum(GHI(merra))
Delta = (Gm - Gs)/Gs
giving the normalization advantage to SARAH as being the more trustworthy model. With this, we get
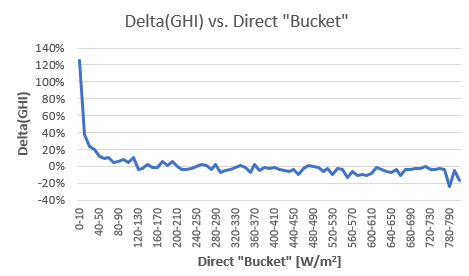
Hence, it appears that DISC overestimates direct radiation for cases where there is not much of it. Conversely, DHI is estimated similarly for SARAH and Merra (559kWh/a and 511kWa/a respectively) with an R2 = 0.68 for a scatter on an hourly basis, which sounds reasonable to me.
Some more background, in case somebody might want to follow up (sounds like a diploma thesis to me") ):
):
Kind regards, Stefan
thanks for your help. Especially the handbook link proved helpful to get some better understanding.
But upfront an apology: the quoted very low system performance of 7850kWh/a was not based on TMY from PVGIS, but from EnergyPlus (too many files on my disk right now). The TMY from PVGIS (in it's 2007 - 2016 incarnation) results in a system output of 9849kWh. This narrows the gap to merra, but it's still ~16%; the PVGIS output sounds more reasonable, talking to local providers of PV systems here.
So, let's dig a level deeper. First, the handbook (p. 33, chapter 2.4.3) educated me on the fundamental equation (... now you know from which level of understanding I'm coming from
):GHI = DNI*cos(SZA) + DHI
For merra, Siren's makeweatherfiles help file states: DNI is computed using formulae derived from the NREL Centre for Renewable Energy Resources DISC DNI Model. The handbook gives some background on p.33ff. with the caveat 'The model is not a rigorous physical algorithm, because the coefficients for computing clear-sky transmittance values were derived from empirical regression analyses of measured DNI and GHI data from Atlanta, Georgia'
The handbook also explains in 5.4.15 for PVGIS (albeit for an old version and not the current v5.0) that 'Monthly averages of daily sums of global and diffuse irradiation measured or calculated for 566 ground meteorological stations distributed over the region.'
Based on this, I investigated GHI - DHI = Direct_Irradiation, which is then the direct contribution to the radiation. Plotting Direct_Irradiation for SARAH vs. Merra (with hourly data), it becomes obvious that in many instances where SARAH has zero or very small values, Merra has substantial contributions (up to 600 W/m2) of direct radiation. To quantify this, let's bucket Direct_Irradiation(SARAH) into buckets of 10 W/m2 and then for each bucket calculate
Gs = sum(GHI(SARAH))
Gm = sum(GHI(merra))
Delta = (Gm - Gs)/Gs
giving the normalization advantage to SARAH as being the more trustworthy model. With this, we get
Hence, it appears that DISC overestimates direct radiation for cases where there is not much of it. Conversely, DHI is estimated similarly for SARAH and Merra (559kWh/a and 511kWa/a respectively) with an R2 = 0.68 for a scatter on an hourly basis, which sounds reasonable to me.
Some more background, in case somebody might want to follow up (sounds like a diploma thesis to me
):
- coordinates used are in Germany, 51.78N, 6.10E
- PVGIS doesn't provide files with GHI, DNI and DHI nicely listed. But one can cheat by configuring a PV system with panel slope = 0deg. and download without radiation components. This results in G_i = GHI; then one can download the same with radiation components to get D_i = DHI. The validity of this approach was verified by comparing resulting GHI, DNI and DHI with TMY data (incarnation 2007 - 2016). Parameters correlated perfectly for Jan - Apr, but not for May - Dec, which resulted in a bug report to PVGIS.
- the handbook also states that PVGIS also accounts for sky obstruction (shadowing) by local terrain features (hills or mountains) calculated from the DEM. This should not be relevant here, as diverging data points occur throughout the day and the horizon is <= 4 deg. around here.
Kind regards, Stefan
Attachments:
Please Log in or Create an account to join the conversation.
- Oscar
Less
More
- Posts: 1
23 Dec 2019 15:02 #7849
by Oscar
Replied by Oscar on topic TMY (PVGIS data) vs. actual year discrepancy (merra-2 data)
Paul,
on a similar note, i am trying to develop my own weather files to run specific years, that i downloaded through the hourly time series from PVGIS.
I have followed much of the formulas listed in my college textbook, Renewables and efficient electric power systems by Gilbert M. Masters. I am stuck with trying to validate my calculated GHI's with SAM's calculated GHI.
when i run the Solar resource file checker, my data GHI fails with "beam+diffuse .... inconsistent with global .... at record x by greater than 20 percent.
it appears that i may have my solar angles off, but i can't seem to figure it out how to adjust them so that they match.
-Oscar
Please Log in or Create an account to join the conversation.
- Paul Gilman
Less
More
- Posts: 5707
06 Jan 2020 10:43 #7856
by Paul Gilman
Replied by Paul Gilman on topic TMY (PVGIS data) vs. actual year discrepancy (merra-2 data)
Hi Oscar,
SAM reports the sun angles in the time series results. You could use that data to compare to the values you calculated. You can find the variables on the Data Tables, Time Series, and Statistics and other tabs on the Results page:
Sun altitude angle (deg)
Sun azimuth angle (deg)
Sun zenith angle (deg)
Sun position time (hour):
Sun up over horizon (0/1/2/3)
Best regards,
Paul.
Please Log in or Create an account to join the conversation.
- Stefan_E
- Topic Author
Less
More
- Posts: 4
06 Jan 2020 15:02 #7862
by Stefan_E
Replied by Stefan_E on topic TMY (PVGIS data) vs. actual year discrepancy (merra-2 data)
Oscar,
I believe I‘ve seen a similar error (can‘t check exacts, as I‘m travelling ...)
I then noted that my PVGIS files were for 11min after the hour; In the .smw header line there is a time stamp which gives the offset; I had to set that to 00:11:00; then „my“ error was gone
Stefan
I believe I‘ve seen a similar error (can‘t check exacts, as I‘m travelling ...)
I then noted that my PVGIS files were for 11min after the hour; In the .smw header line there is a time stamp which gives the offset; I had to set that to 00:11:00; then „my“ error was gone
Stefan
Please Log in or Create an account to join the conversation.
Moderators: Paul Gilman